 Market Liberator
Documentation
Getting Started
Everything you need to add Market Liberator to a TradingView chart, read it, and set alerts. Then open the guide for your script.
The scripts
All scripts run on TradingView and work on any market TradingView charts: crypto, forex, stocks, indices, gold and futures. Market Liberator S/R and a few Market Liberator Pro features need volume data, which some symbols don't have (see no-volume symbols).
Add Market Liberator Suite
- Open a chart on TradingView.
- Click Indicators (the
fxbutton in the top toolbar) or press/. - Search for Market Liberator under Community, or open the script page from our TradingView profile.
- Click the script to add it to your chart. Hover its name and click the star to save it in Favorites.
Add Market Liberator Pro (invite-only)
Market Liberator Pro is an invite-only script. Only TradingView usernames that have been given access can add it.
- Buy Market Liberator Pro on this site and enter your exact TradingView username (not your display name or email) at checkout. Access is added instantly.
- On a chart, click Indicators or press
/. - In the left column under Personal, open Invite-only. This tab only appears once at least one invite-only script has been shared with your account.
- Click Market Liberator Pro once to add it, then star it.
Can't see it? See Invite-only script not showing.
Set alerts on bar close
Alerts let TradingView tell you when something happens, even with the chart closed. TradingView runs them on its servers.
- Add the script to your chart and pick the timeframe you want the alert on.
- Click Alert in the top toolbar (or right-click the chart and choose Add alert).
- Under Condition, choose the script (for example Market Liberator Pro), then the alert you want, such as Trend flip.
- Set Trigger to Once per bar close.
- Choose how to be notified and click Create.
Next steps
- Market Liberator Suite guide: what A, B and S/R show and how to read them.
- Market Liberator Pro guide: each component, every setting and its default, and the alerts.
- FAQ and troubleshooting: missing scripts, slow charts and blank zones.
Market Liberator Suite
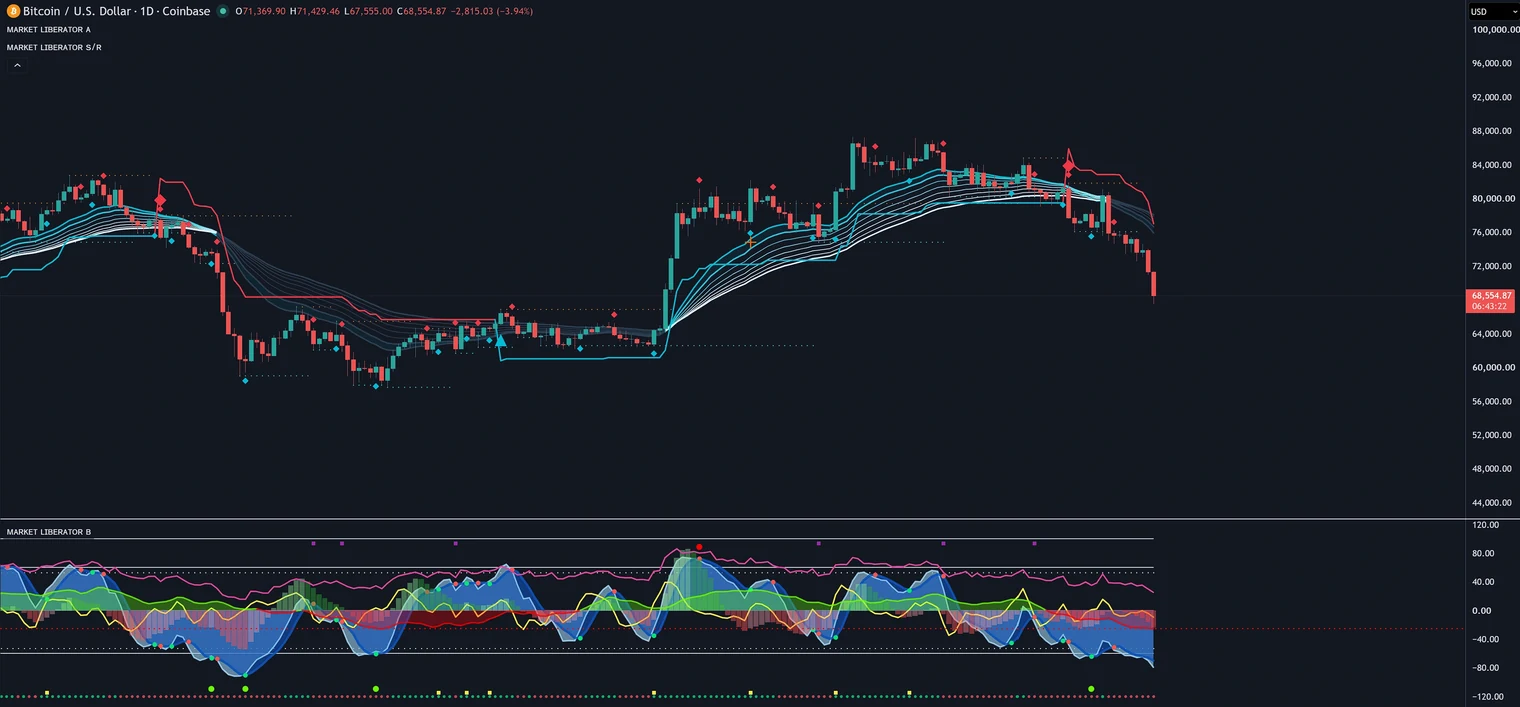
Three TradingView indicators that work on any market. A shows the trend on your candles, B shows momentum in its own pane underneath, and S/R marks support and resistance levels.
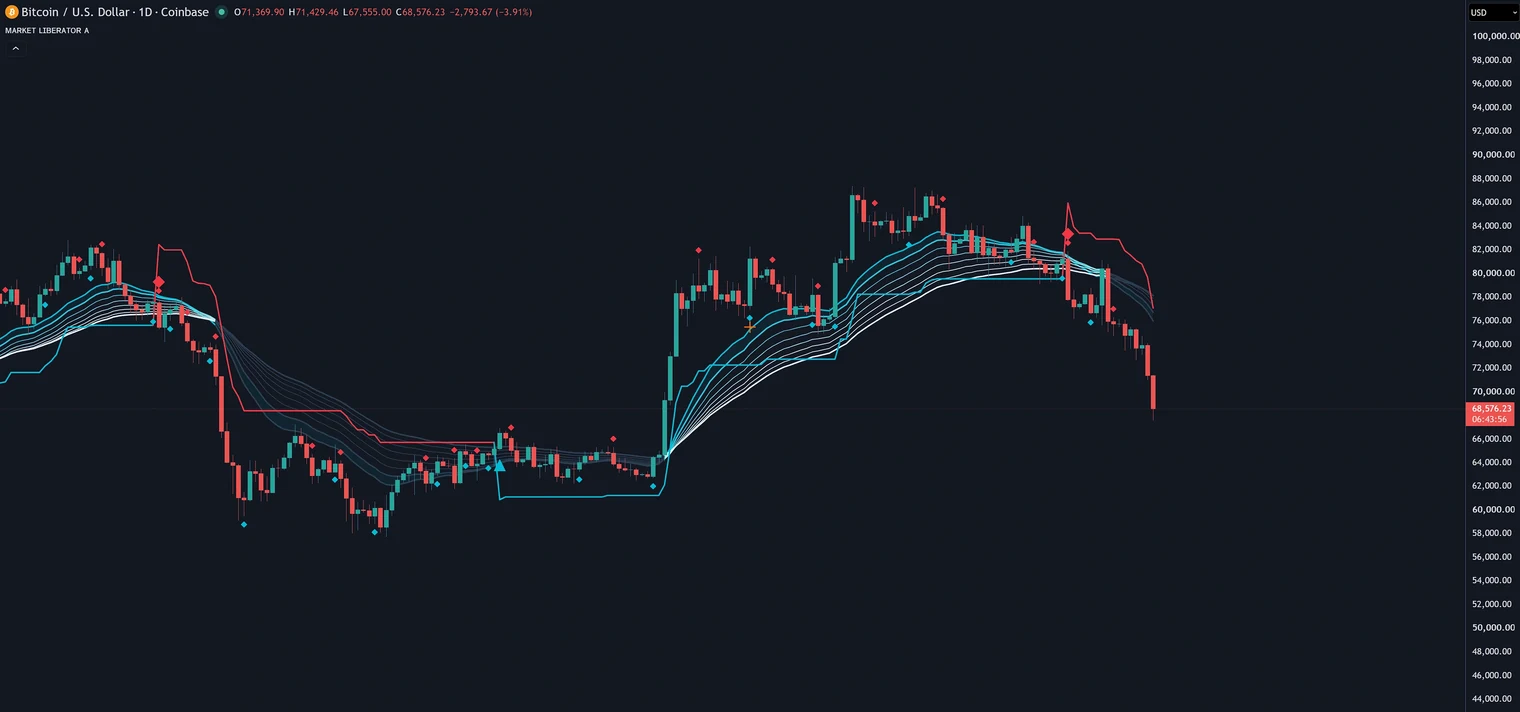
Market Liberator A (trend)
A sits on your price chart. It answers one question: which way is the trend, and is it still intact?
- Moving-average ribbon. A layered band of moving averages on the candles. When the ribbon fans out and price stays on one side of it, the trend is strong. When it twists and flattens, the market is undecided.
- Stepped trailing line. A line that steps along behind price and flips sides when the trend turns. It gives you a clear "trend still on / trend has turned" level.
- Markers. Diamond, cross and triangle shapes mark moments the script flags on the chart.
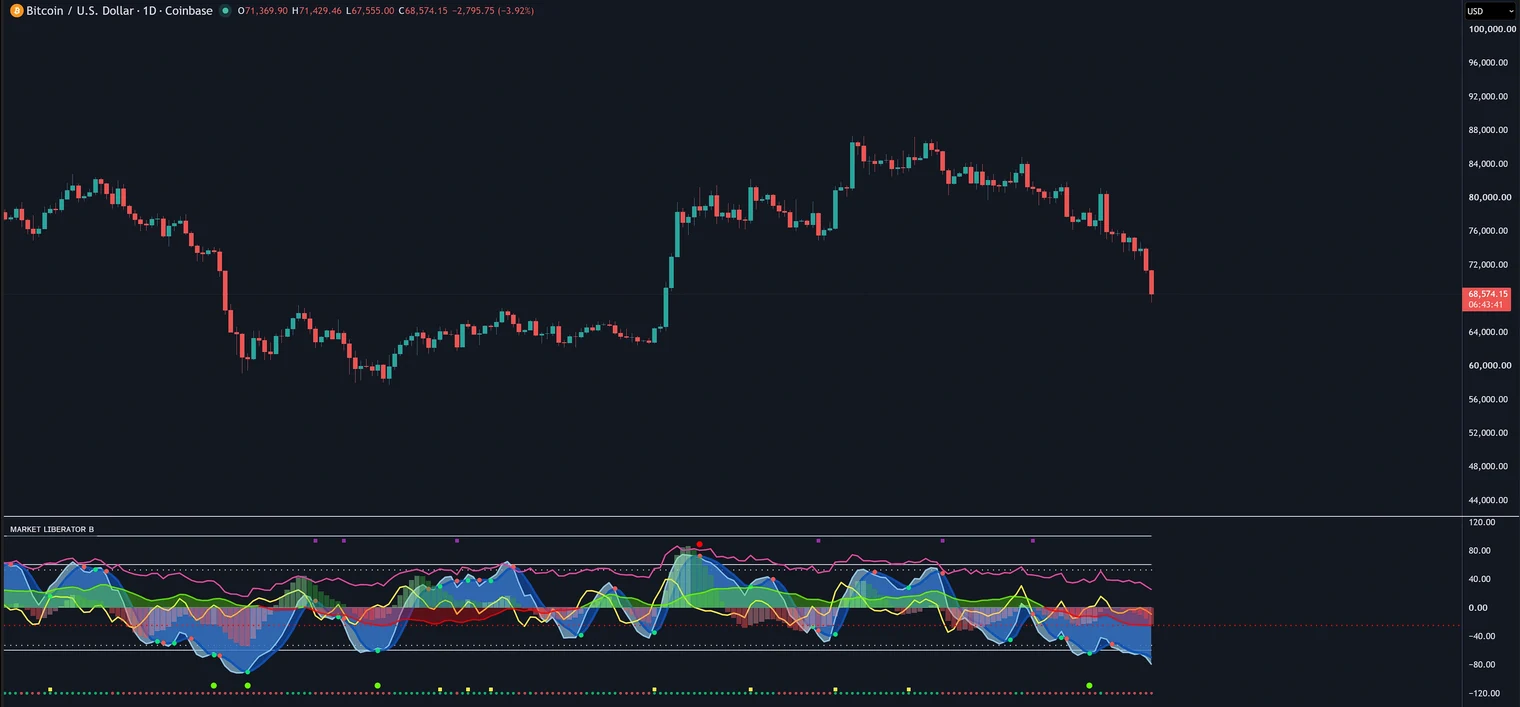
Market Liberator B (momentum)
B runs in its own pane below price. It shows how hard price is being pushed, which isn't always obvious from the candles.
- Smoothed wave. Rises as upward momentum builds and falls as downward momentum builds. A wave that turns while price is still moving can show a push losing steam.
- Momentum histogram. Bars that grow while momentum builds and shrink as it fades.
- Signal lines. Help show where momentum shifts direction.
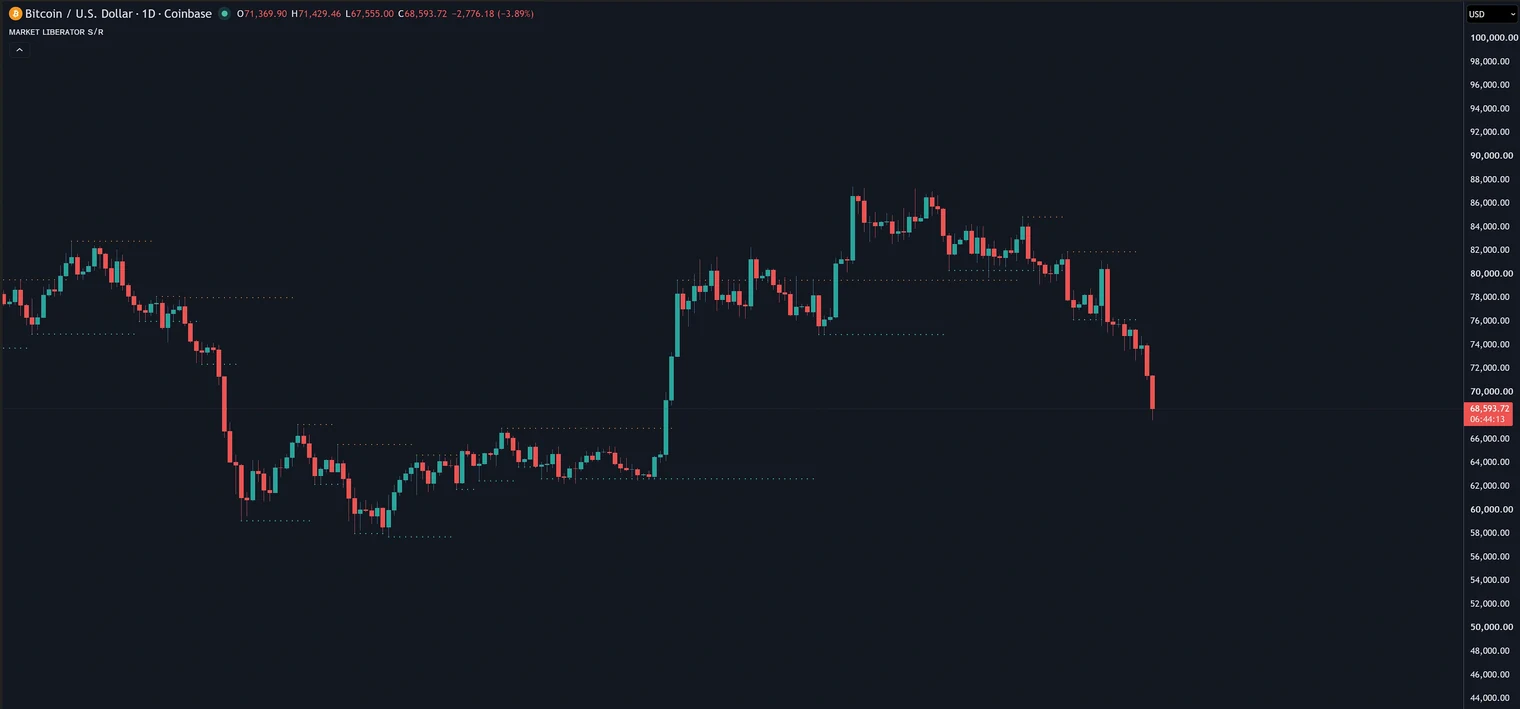
Market Liberator S/R (support and resistance)
S/R sits on your price chart and marks the most recent support and resistance levels: prices where the market turned and enough traders took part to matter.
- How a level is made. A resistance level is set at a high that is a clear turning point: two rising highs into it and two lower highs after it. That candle's volume must also be above the average of the last 6 candles. Support is the same, using lows.
- How it's drawn. A row of small crosses at that price, carried forward until a newer turning point replaces it.
- Slight delay. A turning point needs two more candles after it to be confirmed, so a new level appears a few candles after the high or low. It's drawn back at the turning candle so it lines up.
- Higher timeframes (optional). You can add levels from two higher timeframes, worked out the same way and drawn as circles.
How to read it: orange crosses are resistance above, cyan crosses are support below. These are prices to watch for a reaction, but levels can break. If price closes beyond a level, it has broken; the line stays on the chart until a newer turning point replaces it. Treat levels as context, not trade signals.
Main Market Liberator S/R settings:
| Setting | Default | What it does |
|---|---|---|
| Show Current Support / Resistance | On | Levels from your chart's own timeframe (orange resistance, cyan support). |
| Show MTF 1 Support / Resistance | Off | Adds levels from a higher timeframe (yellow resistance, green support). |
| Custom MTF 1 | 240 (4H) | The timeframe for MTF 1 levels. |
| Show MTF 2 Support / Resistance | Off | Adds levels from a second higher timeframe (red resistance, blue support). |
| Custom MTF 2 | 1D | The timeframe for MTF 2 levels. |
Market Liberator S/R has no alerts. Want more? Market Liberator Pro's zones go further, with zone thickness, broken-zone tracking and a hold chance near price.
Reading them together
A tells you the direction. B tells you whether the push behind it is building or fading. S/R shows where price may react. A simple way to use them:
- Use A for the trend. Only look for longs while price holds above the ribbon and trailing line, and only shorts below them.
- Use B for timing. A pullback in the trend while B's wave turns back in the trend's direction is a cleaner moment than chasing a big candle.
- Use S/R for location. A pullback into a support level in an uptrend (or into resistance in a downtrend) gives you a clear level to judge the trade against.
- Be careful when they disagree. If A still says up but B keeps making lower peaks, momentum is fading and the trend may be tiring.
Settings and alerts
You can see every setting for A, B and S/R in the script's settings window in TradingView (double-click the script on your chart). The general alert steps are in Getting started. Set the trigger to Once per bar close.
Market Liberator Pro
One invite-only TradingView script that puts trend, key levels and context on your chart. Every percentage it shows is learned from the chart you’re looking at, not from a fixed rulebook.
Open the settings with the gear icon next to the script name. Settings are grouped by feature, matching the names on this page (for example 📈 Trend Cloud, 🧱 Support & resistance zones, 🧭 Market structure, 📊 Volume profile and 🪧 Info panel).
This guide covers everything in the current Market Liberator Pro script: the Trend Cloud, Pullback Candles, Zones, SMC (market structure, fair value gaps, sweeps, and yesterday and last week’s highs and lows), VPVR, higher-timeframe candles, the info panel, and alerts.
Trend Cloud
The Trend Cloud is a coloured band that follows price. Cyan means the trend is up, red means it's down.
The cloud only flips after candles close beyond its far edge. A wick through the cloud isn’t enough on its own.
How to read it: stay with the colour of the cloud for bias. A long stretch of cyan is an uptrend; a flip to red means the trend has turned down. Use Trend speed if you want it to turn sooner (Fast) or hold through more chop (Slow).
| Setting | Default | What it does |
|---|---|---|
| Show Trend Cloud | On | The coloured band around price. Cyan means the trend is up, red means it's down. |
| Trend speed | Normal | Normal suits most charts. Fast reacts sooner to turns but flips more often. Slow suits swing trading and higher timeframes: fewer, longer trends and fewer false flips in choppy markets, but it turns later. Options: Normal, Fast, Slow. |
| Trend Cloud ⬆ / ⬇ | Cyan (#00BCD4) | Uptrend colour for the cloud. This is the left colour in the Trend Cloud ⬆ / ⬇ pair. |
| Trend Cloud ⬇ | Red (#FF5A6A) | Downtrend colour for the cloud. This is the right colour in the Trend Cloud ⬆ / ⬇ pair. |
Pullback Candles
A candle is coloured bright when price pulls back into the Trend Cloud while momentum is pushing against the trend. By default that colour is yellow in both directions. You can set a different colour for uptrends and downtrends.
In plain terms: the trend is still intact, but price has dipped back into the cloud. That’s the pulled-back moment many traders wait for instead of chasing. The candle is only coloured once it has closed, so it never appears and then disappears.
| Setting | Default | What it does |
|---|---|---|
| 🕯️ Pullback candles | On | A bright yellow candle marks a pullback into the Trend Cloud. Confirmed on close. |
| Pullback candle ⬆ / ⬇ | Yellow (#FFE14D) | Candle colour in an uptrend. This is the left colour in the Pullback candle ⬆ / ⬇ pair. |
| Pullback candle ⬇ | Yellow (#FFE14D) | Candle colour in a downtrend. This is the right colour in the Pullback candle ⬆ / ⬇ pair. |
Zones
Zones are price areas where the market turned before. Red zones are resistance above price, cyan zones are support below. Nearby turns are merged into one zone. By default only the nearest support and the nearest resistance are shown (Zones per side = 1). You can raise that up to 3.
When price breaks through a zone, the zone flips role (old resistance becomes support and vice versa) and gets a dotted middle line.
How Hold Chance Works
Far from price, a zone label just shows its price, like S 1.0850. When price gets close enough (the Show hold chance within setting), the label changes to something like Support · Hold chance 61% (the number here is just an example).
The percentage is learned from this chart’s own history: how often similar tests of a zone have held rather than broken. It is a chance, not a promise, and it is kept in a sensible range. Nothing here is a trade signal.
| Setting | Default | What it does |
|---|---|---|
| Show zones | On | Key price areas. Red is resistance above price, cyan is support below. |
| Zones per side | 1 | How many of the nearest zones to show above price (resistance) and below (support). 1 keeps the chart lean: the nearest support and the nearest resistance only (1 to 3). |
| Recently broken zones | 0 | Also show this many zones that price recently broke through, faded (0 to 10). |
| Show hold chance within | 1.0 | The hold chance only appears when price is this close to a zone. Higher shows it from further away. Otherwise the label shows just the zone price. |
| Zone thickness | 0.35 | How tall each zone is drawn. |
| Merge nearby zones | 0.6 | Zones closer together than this are combined into one. |
| Hide distant zones | 10.0 | Zones further than this from price are hidden to keep the chart clean. |
| Support / Resistance | Cyan (#00BCD4) | Colour for support zones below price. This is the left colour in the Support / Resistance pair. |
| Resistance | Red (#F23645) | Colour for resistance zones above price. This is the right colour in the Support / Resistance pair. |
SMC
SMC in Market Liberator Pro groups the smart-money style context on the chart: market structure and ChoCH, optional swing labels, fair value gaps, liquidity sweeps, and yesterday and last week’s highs and lows. Related chart markers for zone breaks, retests and momentum also live here.
Market Structure
Market Liberator Pro marks a Bullish ChoCH or Bearish ChoCH (change of character) with a dashed line when price closes through the last confirmed swing against the existing structure. For example, if structure has been making lower lows and price closes above the last swing high, that’s a Bullish ChoCH.
Labels only appear once the swing and the close are confirmed, so they never repaint. You can also turn on swing labels to see each confirmed swing marked as HH, HL, LH or LL.
| Setting | Default | What it does |
|---|---|---|
| 🧭 Show market structure | On | Marks a Bullish ChoCH or Bearish ChoCH (change of character), with a dashed line, when price closes through the last confirmed swing against the prior structure. Only marked once confirmed, so it never repaints. |
| Structure shifts to keep | 4 | Only the most recent shifts stay on the chart (1 to 20). |
| Swing labels (HH / HL / LH / LL) | Off | Labels each confirmed swing as a higher high, lower high, higher low or lower low. Off by default to keep the chart clean. |
| Swing labels to keep | 4 | Only the most recent swing labels stay on the chart (2 to 40). |
Fair Value Gaps
When Fair value gap is on, Market Liberator Pro shows two amber gaps: the nearest unbroken bullish gap and the nearest unbroken bearish gap to price. A gap is a three-candle imbalance, and it is marked only after the third candle has closed, so it does not appear and then vanish on the forming bar.
Active gaps use a thin amber outline and a faint fill. The box starts at the left candle of the three and extends 3 candles past the current bar, so you can still see it beside price. When a gap is broken, it turns into a grey dashed box that stops at the break candle and no longer extends. By default one recently broken bullish gap and one recently broken bearish gap are kept (Max broken FVGs shown = 1). Set that to 0 to hide broken gaps.
FVG mitigation controls what counts as a break: Wick (default) breaks the gap as soon as a candle’s high or low trades through its far side; Close waits for a candle to close through that side.
| Setting | Default | What it does |
|---|---|---|
| Fair value gap | On | Shows two amber gaps: the nearest unbroken bullish gap and the nearest unbroken bearish gap to price. A gap is marked once the third candle has closed. When price trades through its far side it turns into a grey dashed box that stops at the break candle. Off hides all of them. |
| FVG mitigation | Wick | Wick: a gap is broken as soon as a candle’s high or low trades through its far side. Close: only when a candle closes through its far side. Options: Wick, Close. |
| Max broken FVGs shown | 1 | Broken (grey dashed) gaps kept per side: the most recently broken bullish and bearish ones. 1 = one of each. 0 hides them (0 to 2). |
| Fair value gap | Amber (#FF9F1C) | Thin outline colour for active gaps. Bright amber-orange, so it stands out from support (cyan), resistance (red), sweeps, the most-traded-price line, and yesterday levels. |
Liquidity Sweeps
A sweep is when price pokes past the last swing high or low and then closes back inside. Stops often sit just beyond swing points, so a quick poke-and-reject can mean those orders were taken before price reversed. Market Liberator Pro adds a gold Sweep label and a dashed line from the swing that was swept. Each swing can only be swept once. A very recent high or low can’t be swept until that swing has been confirmed.
Chart Markers
Sweeps sit in the 📍 Chart markers group with the other optional markers. Break and retest markers watch the zones.
| Setting | Default | What it does |
|---|---|---|
| Sweeps | On | Price poked past the last swing high or low, then closed back inside. |
| Break up / break down | Off | Price closed through a support or resistance zone. |
| Retest held | Off | Price came back to a broken zone and bounced off it. |
| Max markers on chart | 6 | Older markers are removed beyond this number (1 to 200). |
| Sweeps | Gold (#F5C76B) | Colour of sweep labels and lines. |
Yesterday And Last Week Levels
Dotted lines at the high and low of the last finished daily and weekly candles. These are levels many traders watch. When yesterday and last week land at the same price, they share one label.
| Setting | Default | What it does |
|---|---|---|
| Yesterday high / low | On | Dotted lines at the high and low of the last finished daily candle. When yesterday and last week land at the same price, they share one label. |
| Last week high / low | On | Dotted lines at the high and low of the last finished weekly candle. |
| Fallback line length (bars) | 60 | Only used if the bar where the high or low happened can’t be found, for example on a short chart history (10 to 300). |
| Yesterday / Last week | Grey (#8A93A3) | Colour for yesterday’s high and low. This is the left colour in the Yesterday / Last week pair. |
| Last week | Gold (#C9A55A) | Colour for last week’s high and low. This is the right colour in the Yesterday / Last week pair. |
VPVR
The volume profile (VPVR) draws horizontal bars on the left of the chart to show how much was traded at each price over the last 200 candles (changeable). The most traded price is drawn as a line through the profile and extends a few bars past the current candle, so it stays easy to see. The brighter middle band is the value area, which by default holds 70% of the volume. Like zones, this needs volume data.
| Setting | Default | What it does |
|---|---|---|
| Show volume profile | On | Bars on the left show how much was traded at each price. The line is the most traded price. |
| Candles to measure | 200 | How many recent candles the profile covers (50 to 480). |
| Rows | 48 | More rows give more detail (12 to 96). |
| Width (bars) | 20 | How wide the profile is drawn (5 to 100). |
| Value area % | 70 | The brighter middle band holds this share of all volume traded (10 to 100). |
| Volume profile / Most traded | Grey (#B2B5BE) | Bar and value-area colour. Leave the default to follow the chart theme (neutral grey). This is the left colour in the Volume profile / Most traded pair. |
| Most traded | White (#FFFFFF) | Colour of the most-traded-price line. The default is white on dark charts; on light charts it follows a dark grey. This is the right colour in the Volume profile / Most traded pair. |
Higher-Timeframe Candles
Market Liberator Pro can draw candles from up to three higher timeframes to the right of price, so you can see the daily or weekly candle forming without switching charts. Each group is labelled with its timeframe and the time left on the current candle. The timeframe must be higher than your chart’s.
By default Slot 1 (4H) is off, and Slot 2 (Daily, 7 candles) and Slot 3 (Weekly, 3 candles) are on. Tick a slot, pick its timeframe, and set how many candles to draw.
When Show stats under the forming candle is on, each forming candle shows:
- Range used: how big the forming candle is so far versus a normal candle on that timeframe. 120% means it's already bigger than usual.
- Closes green: how often past candles in the same spot went on to close above their open. It shows “–” until there are enough past examples.
| Setting | Default | What it does |
|---|---|---|
| Slot 1 · candles | Off | Tick to show this slot. The timeframe must be higher than your chart’s. |
| Slot 1 timeframe | 240 (4H) | The timeframe for slot 1. This is the middle control in the Slot 1 · candles row. |
| Slot 1 candle count | 6 | How many candles to draw for slot 1 (1 to 20). This is the right control in the Slot 1 · candles row. |
| Slot 2 · candles | On | Tick to show this slot. The timeframe must be higher than your chart’s. |
| Slot 2 timeframe | D | The timeframe for slot 2. This is the middle control in the Slot 2 · candles row. |
| Slot 2 candle count | 7 | How many candles to draw for slot 2 (1 to 20). This is the right control in the Slot 2 · candles row. |
| Slot 3 · candles | On | Tick to show this slot. The timeframe must be higher than your chart’s. |
| Slot 3 timeframe | W | The timeframe for slot 3. This is the middle control in the Slot 3 · candles row. |
| Slot 3 candle count | 3 | How many candles to draw for slot 3 (1 to 20). This is the right control in the Slot 3 · candles row. |
| Distance from last candle (bars) | 45 | How far to the right of price the candles start. Raise it if they overlap the zone labels (5 to 150). |
| Show stats under the forming candle | On | Range used: how big the forming candle is so far versus a normal candle on that timeframe. Closes green: how often past candles in the same spot went on to close above their open. |
| HTF candles ⬆ / ⬇ | Cyan (#00BCD4) | Up-candle colour. This is the left colour in the HTF candles ⬆ / ⬇ pair. |
| HTF candles ⬇ | Red (#F23645) | Down-candle colour. This is the right colour in the HTF candles ⬆ / ⬇ pair. |
Info Panel
A summary box on the chart (top right by default). Panel layout is Compact by default, which keeps a phone-friendly row with the trend, a length gauge, and four timeframe tiles. Full is the wider desktop layout. Panel size sets the text size used by the Full layout.
- Trend: whether the Trend Cloud is up or down, and how many candles the current trend has run.
- Length gauge: how old this trend is compared with a typical trend in the same direction on this chart.
- Four timeframe tiles: the Trend Cloud’s direction on the four timeframes you pick.
Multi-Timeframe Direction
The four tiles in the panel show the Trend Cloud’s direction on the Trend timeframes you choose. The defaults are 1H, 4H, Daily and Weekly. Pick any four timeframes. This is the multi-timeframe direction readout: a quick view of whether those higher (or other) timeframes agree with the chart you’re on.
| Setting | Default | What it does |
|---|---|---|
| Show panel | On | The summary box with trend direction, how long trends in that direction usually last on this chart, and the trend on four timeframes. |
| Position | Top right | Where the panel sits. Options: Top right, Middle right, Bottom right, Top left, Bottom left. |
| Panel size | Small | Text size for the Full layout. Compact uses small text so it stays readable on a phone. Options: Tiny, Small, Normal. |
| Panel layout | Compact | Compact is a phone-friendly panel with the trend, a length gauge, and four timeframe tiles in one row. Full is the wider desktop layout. Options: Compact, Full. |
| Trend timeframes | 60 (1H) | The first of the four tiles in the panel. The four tiles show the Trend Cloud’s direction on these timeframes. Pick any four. |
| Trend timeframe 2 | 240 (4H) | The second of the four Trend timeframes tiles. |
| Trend timeframe 3 | D | The third of the four Trend timeframes tiles. |
| Trend timeframe 4 | W | The fourth of the four Trend timeframes tiles. |
| Panel accent / background | Red (#F23645) | Accent colour for the panel. This is the left colour in the Panel accent / background pair. |
| Panel background | Dark (#131722) | Background colour of the panel. This is the right colour in the Panel accent / background pair. |
Alerts
Market Liberator Pro has 13 alerts. Set them up as shown in Getting Started, with the trigger set to Once Per Bar Close.
| Alert | Message | When it fires |
|---|---|---|
| Pullback candle (uptrend) | ML Pro: pullback candle in an uptrend on {{ticker}} {{interval}} | A pullback candle closed in an uptrend. |
| Pullback candle (downtrend) | ML Pro: pullback candle in a downtrend on {{ticker}} {{interval}} | A pullback candle closed in a downtrend. |
| Trend flip | ML Pro: trend flipped on {{ticker}} {{interval}} | The Trend Cloud changed direction on a closed candle. |
| Break above resistance | ML Pro: price broke above the nearest resistance zone on {{ticker}} {{interval}} | Price closed above the nearest resistance zone. |
| Break below support | ML Pro: price broke below the nearest support zone on {{ticker}} {{interval}} | Price closed below the nearest support zone. |
| Bullish ChoCH | ML Pro: bullish ChoCH on {{ticker}} {{interval}} | A bullish change of character was confirmed. |
| Bearish ChoCH | ML Pro: bearish ChoCH on {{ticker}} {{interval}} | A bearish change of character was confirmed. |
| Break above last week high | ML Pro: price broke above last week's high on {{ticker}} {{interval}} | Price closed above last week’s high. |
| Break below last week low | ML Pro: price broke below last week's low on {{ticker}} {{interval}} | Price closed below last week’s low. |
| Price enters bullish FVG | ML Pro: price entered a bullish fair value gap on {{ticker}} {{interval}} | Price moved into a bullish fair value gap. |
| Price enters bearish FVG | ML Pro: price entered a bearish fair value gap on {{ticker}} {{interval}} | Price moved into a bearish fair value gap. |
| Liquidity sweep high | ML Pro: liquidity sweep of a swing high on {{ticker}} {{interval}} | A liquidity sweep of a swing high was confirmed. |
| Liquidity sweep low | ML Pro: liquidity sweep of a swing low on {{ticker}} {{interval}} | A liquidity sweep of a swing low was confirmed. |
FAQ And Troubleshooting
Quick fixes for the issues people hit most often.
Invite-only script not showing
- No "Invite-only" tab at all? TradingView only shows the tab once an invite-only script has been shared with your account. Access may not have gone through yet.
- Check your username. Access is tied to your exact TradingView username, not your display name or email. Make sure you're logged in to that same account.
- Reload. Refresh the page, or log out and back in, after access is granted.
- Still missing? Contact us with your TradingView username via Discord or email.
Heavy-script warning or slow chart
Market Liberator Pro does a lot on one chart: zones, a learning model, a volume profile and higher-timeframe candles. On long histories or slow devices, TradingView may warn that the script is heavy or take longer to load. Zones default to one per side, and the fair value gap uses only one box, so those layers are already lean. To lighten it further:
- Turn off Show volume profile if you don't use it.
- Turn off higher-timeframe slots you don't need.
- Turn off Show stats under the forming candle.
- Lower Max stored tests in the hold chance model group.
Then remove the script and add it again to reload it.
No S/R levels, zones or volume profile
Market Liberator S/R levels, Market Liberator Pro zones and the volume profile need volume data. A turning point only becomes a zone if its volume beat the recent average, so on a symbol with no volume, no zones form. Many indices and some forex and CFD feeds have no volume on TradingView.
Fix: switch to a feed of the same market that has volume (for example a futures contract or a crypto exchange pair). The trend cloud, structure, fair value gap, sweeps and panel still work without volume.
Higher-timeframe candles not showing
Each slot's timeframe must be higher than your chart's. On a daily chart, a daily slot won't show. Pick a higher timeframe or drop to a lower chart timeframe. Also check the slot is ticked. If they overlap the zone labels, raise Distance from last candle (bars).
A stat shows "–"
Market Liberator Pro only shows a number when it has enough history on this chart. "Closes green" needs at least 10 past examples, the average trend length needs at least 3 past trends, and hold chance needs enough past tests. Scroll back or use a symbol and timeframe with more history.
Markers appear a few candles late
That's by design. Market Liberator Pro waits for confirmation so marks don't move or disappear afterwards:
- Pullback candles, trend flips and the fair value gap wait for the candle to close.
- Swings used by structure and sweeps are confirmed 5 candles after the high or low.
Which markets does it work on?
Any market TradingView charts: crypto, forex, stocks, indices, gold and futures. Market Liberator S/R levels and Market Liberator Pro zones and volume profile need volume data (see above).
Risk warning. Market Liberator provides charting tools for general information and education only. It is not financial product advice and does not take into account your objectives, financial situation or needs. Trading is high risk and you can lose all of your capital. Past performance is not a reliable indicator of future results.